In the previous blog, I reviewed 1D-DCT and 2D-DCT. In this blog, I will check what would happen if you denoise the image via 1D-DCT on flattened image.
Denoising
I will denoise the image by first transforming an image to frequency domain and pick the top $k$ largest DCT coefficients in absolute values. The remaining DCT coefficients are sparcified to zero. The new DCT coefficients are then inverse DCTed to spacial domain. The recovered image is visualized.
Two-dimensional Discrete Cosine Transform as a Linear Transformation
In previous blog post I reviewed one-dimensional Discrete Fourier Transform (DFT) as well as two-dimensional DFT. This short post is along the same line, and specifically study the following topics:
- Discrete Cosine Transform
- Represent DCT as a linear transformation of measurements in time/spatial domain to the frequency domain.
- What would happen if you use 1D DFT on the image, which has two dimensions?
Low and High pass filtering on images using FFT
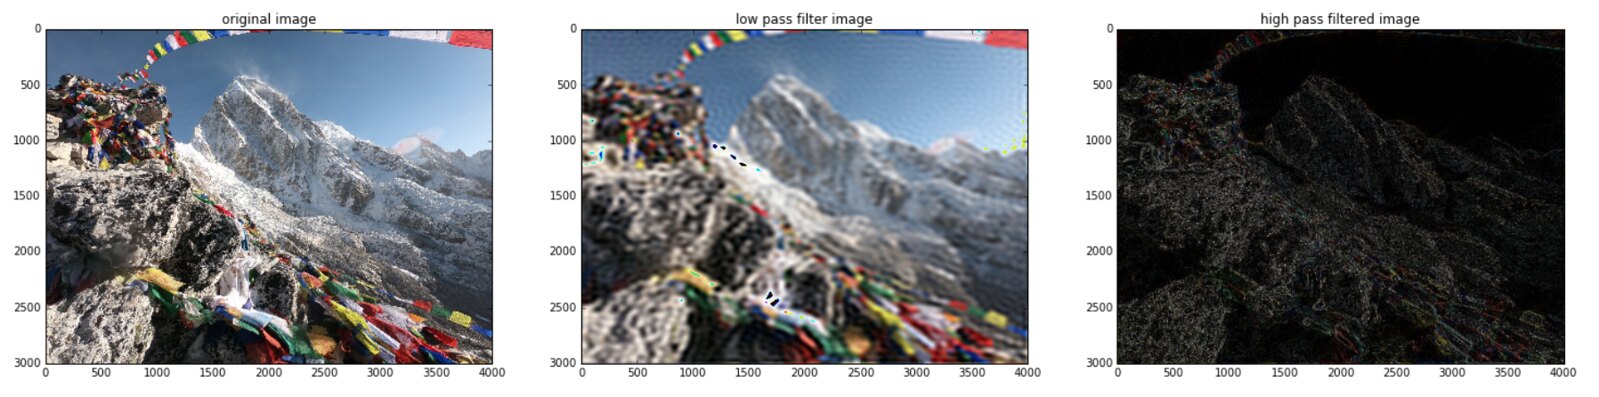
In this blog post, I will use np.fft.fft2 to experiment low pass filters and high pass filters.
**Low Pass Filtering** A low pass filter is the basis for most smoothing methods. An image is smoothed by decreasing the disparity between pixel values by averaging nearby pixels (see Smoothing an Image for more information).
Frequency analysis of images from scratch
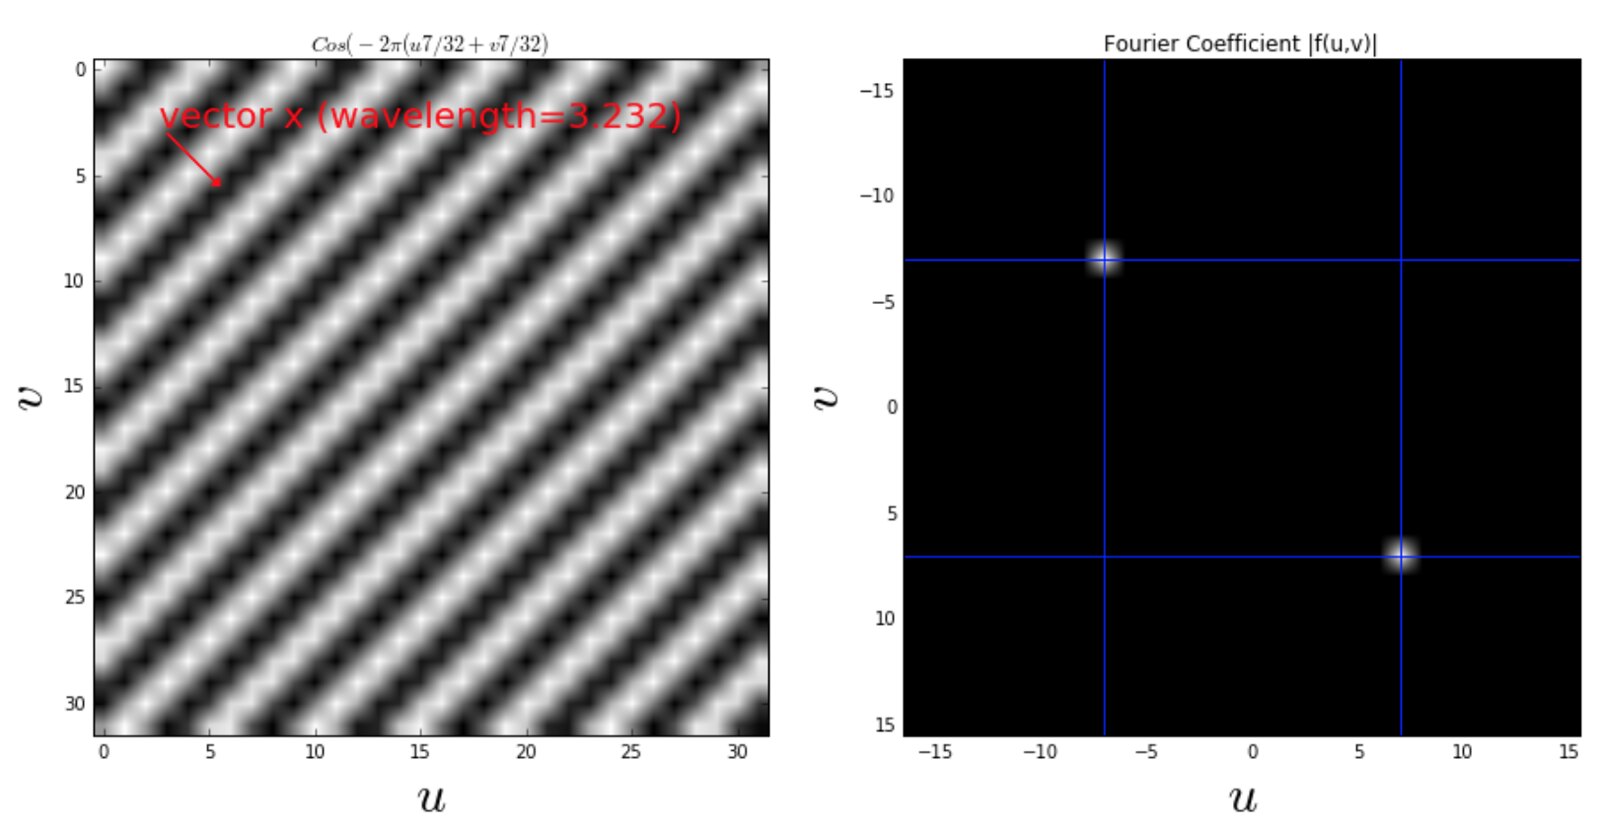
This blog reviews frequency analysis on images. If you follow this blog, you will understand
- The two-dimensional discrete Fourier transform
- How to calculate wavelength of the Sinosoid
- What exactly np.fft.fft2 and np.fft.fftshift are doing.
This blog series on frequency analysis on images will continue Low and High pass filtering experiments
Reference
Decode the dial-up sounds using Spectrogram
Implement the Spectrogram from scratch in python
Spectrogram is an awesome tool to analyze the properties of signals that evolve over time. There are lots of Spect4ogram modules available in python e.g. matplotlib.pyplot.specgram. Users need to specify parameters such as "window size", "the number of time points to overlap" and "sampling rates". So without correct understanding of Spectrogram, I believe that it is difficult to utilize these existing modules.
Review on Discrete Fourier Transform
In this blog, I will review Discrete Fourier Transform (DFT). What it says, its example useage and how to prove it.
Motivation for data scientists to review DFT
Why review on the theory of DFT in my Data Science blog? That is because I blieve that DFT is an essential tool for applied data scientists to analyze degital signals. For example, spectrogram analysis, which is just a graphical representation of short-term DFT, is almost always used to analyze sounds data or evenly-spaced time series data. I also use Spectrogram for time series analysis in my other blog post Implement the Spectrogram from scratch in python