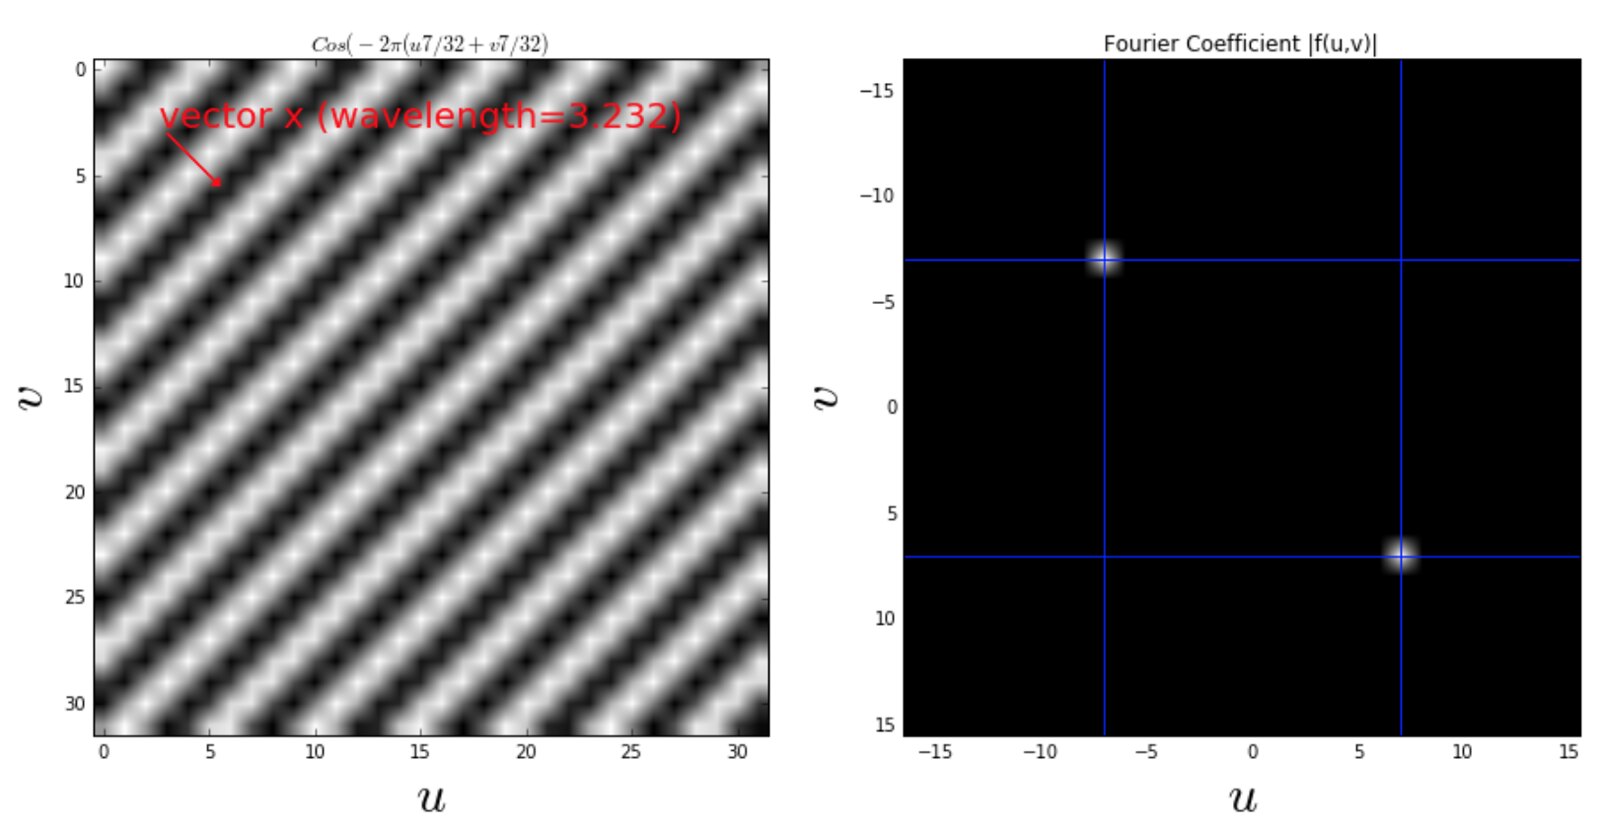
This blog reviews frequency analysis on images. If you follow this blog, you will understand
- The two-dimensional discrete Fourier transform
- How to calculate wavelength of the Sinosoid
- What exactly np.fft.fft2 and np.fft.fftshift are doing.
This blog series on frequency analysis on images will continue Low and High pass filtering experiments
Reference
Decode the dial-up sounds using Spectrogram
Implement the Spectrogram from scratch in python
Spectrogram is an awesome tool to analyze the properties of signals that evolve over time. There are lots of Spect4ogram modules available in python e.g. matplotlib.pyplot.specgram. Users need to specify parameters such as "window size", "the number of time points to overlap" and "sampling rates". So without correct understanding of Spectrogram, I believe that it is difficult to utilize these existing modules.
Review on Discrete Fourier Transform
In this blog, I will review Discrete Fourier Transform (DFT). What it says, its example useage and how to prove it.
Motivation for data scientists to review DFT
Why review on the theory of DFT in my Data Science blog? That is because I blieve that DFT is an essential tool for applied data scientists to analyze degital signals. For example, spectrogram analysis, which is just a graphical representation of short-term DFT, is almost always used to analyze sounds data or evenly-spaced time series data. I also use Spectrogram for time series analysis in my other blog post Implement the Spectrogram from scratch in python
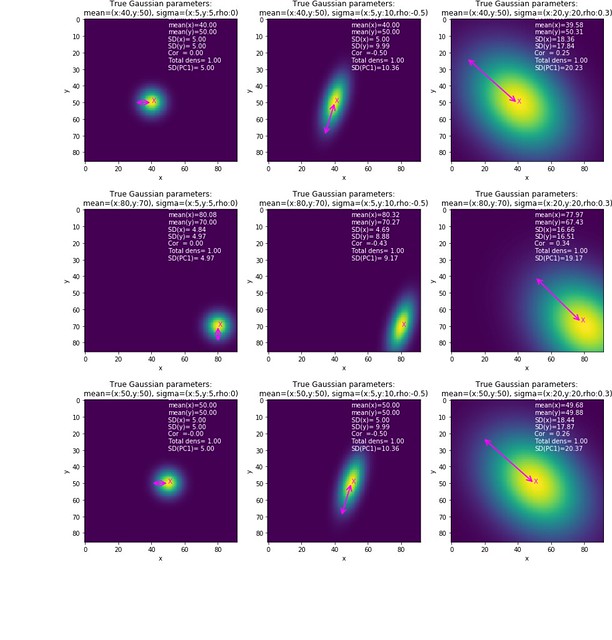
Performing PCA on heatmap

In my previous blog, I reviewed PCA.
The Principal Component Analysis (PCA) techinique is often applied on sample dataframe of shape (Nsample, Nfeat).
In this blog, I will discuss how to obtain the PCA when the provided data is a two-dimensional heatmap.
The two-dimensional heatmap can be thought as a bivariate density on discretized constraint space.
It is discrete because the densiy values are evaluated only at pixcel grids,
and constraint because the grids are bounded.
Review on PCA
Principal Component Analysis (PCA) is a traditional unsupervised dimensionality-reduction techinique that is often used to transform a high-dimensional dataset into a smaller dimensional subspace. PCA seeks a linear combination of variables such that the maximum variance is extracted from the variables. In this blog, I will review this one of the most used applied mathematics teqhiniques.
My first GAN using CelebA data
 Everyone has been lately talking about Generative Adversarial Networks, or more famously known as GAN.
My colleagues, interview candidates, my manager, conferences literally EVERYONE.
It seems like the GANs becomes required knowledge for data scientists in bay area.
It also seems that GANs are cool: GANs can generate new celebility face images, generate creative arts or generate the next frame of the video images. AI can think by itself with the power of GAN.
Welcome to CelebA
In this notebook, I will explore the CelebA dataset.
Evaluate uncertainty using ensemble models with likelihood loss and adverserial training
Evaluating the quality of predictive uncertainties is challenging as "ground truth" uncertainty is usually not available. Yet, model's confidence about its estimation is often of interest for researchers. If the model can tell "what it knows" or what is "out of distribution", such infomation gives insights about when the researchers should take the point estimates as their face values.
Generate adversarial examples using TensorFlow

In this blog post, we will generate adversarial images for a pre-trained Keras facial keypoint detection model.
What is adversarial images?
According to OpenAI, adversarial examples are:
inputs to machine learning models that an attacker has intentionally designed to cause the model to make a mistake; they’re like optical illusions for machines.